
An Assortment of Tropical Analysis and Forecast Tools
Tropical Surface Analysis

24hr Tropical Winds
The Hurricane Tropical Winds map shows high level (about 40,000 feet) wind speed and direction over the Atlantic Ocean.

48hr Tropical Winds

72hr Tropical Winds

SSMI/SSMIS-derived Total Precipitable Water – North Atlantic
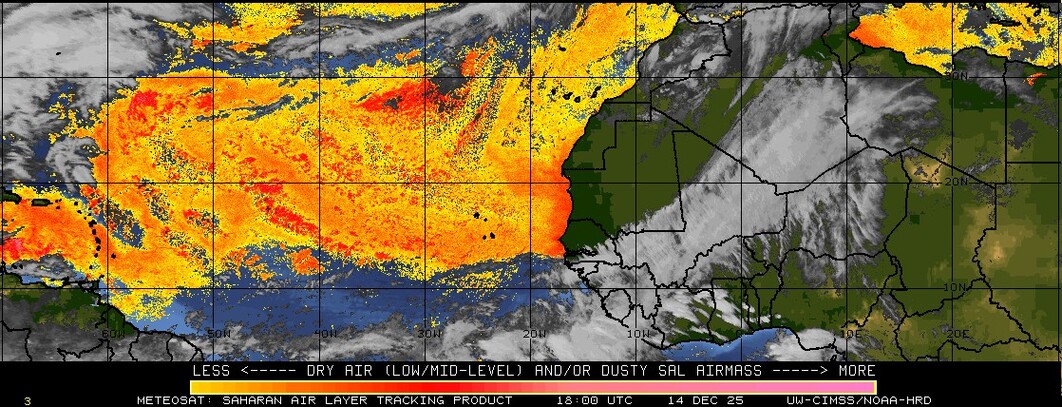
Saharan Air Layer (SAL) Analysis:
Current Tropical Atlantic Surface Weather Analysis:

Current Southwest North Atlantic Surface Analysis:
Current Caribbean Sea Surface Analysis:
Current Gulf of Mexico Surface Analysis:
Current Atlantic Sea State Analysis:

24 Hour NHC Surface Forecast:
48 Hour NHC Surface Forecast:
72 Hour NHC Surface Forecast:
24 Hour Sea Level Pressure Forecast:

24 Hour 500 Millbar Height Forecast:

24 Hour 300 Millbar Pressure Forecast:

24 Hour 300-850 Shear Forecast:

36 Hour Sea Level Pressure Forecast:

36 Hour 500 Millbar Height Forecast:

36 Hour 300 Millbar Pressure Forecast:

36 Hour 300-850 Shear Forecast:

48 Hour Sea Level Pressure Forecast:

48 Hour 500 Millbar Height Forecast:

48 Hour 300 Millbar Pressure Forecast:

48 Hour 300-850 Shear Forecast:

Current Atlantic 700-850 mb Mean Wind Analysis (TC Sfc Pressure Range 1000-1010 mbs):
Current Atlantic 500-850 mb Mean Wind Analysis (TC Sfc Pressure Range 990-999 mbs):
Current Atlantic 400-850 mb Mean Wind Analysis (TC Sfc Pressure Range 970-989 mbs):
Current Atlantic 300-850 mb Mean Wind Analysis (TC Sfc Pressure Range 950-969 mbs):
Current Atlantic 250-850 mb Mean Wind Analysis (TC Sfc Pressure Range 940-949 mbs):
Current Atlantic 200-700 mb Mean Wind Analysis (TC Sfc Pressure Range <940 mbs):
Current Atlantic 850 mb Relative Vorticity Analysis:
Current Atlantic 700 mb Relative Vorticity Analysis:
Current Atlantic 500 mb Relative Vorticity Analysis:
Current Atlantic Low-Level Convergence Analysis:
Current Atlantic Upper-Level Divergence Analysis:
Global IR and WV Satellite


Global SST Anomalies

MJO Analysis and Model Forecasts
What is MJO? Click HERE
TRMM Global Rainfall 30-day Anomalies

Vertical Wind Shear Analysis (850-200 mbs):

Current Atlantic Wind Shear Analysis:
Current Atlantic Wind Shear Tendency Analysis:
Current Eastern Atlantic/African Wind Shear Analysis:
Current Sea Surface Temperature Analysis:

Water Vapor Loop

Infrared Loop


